Flow Table
The Flow Table is a reporting template that breaks down conversational creative performance at the component level. While the standard Table view shows high-level metrics per data source, and the visual Flow template shows a graphical flow diagram, the Flow Table gives you a detailed, sortable table of every component in the conversation flow — prompts, choices, and other interaction nodes — with metrics for each.
This makes it the go-to view for understanding exactly where users engage, continue, drop off, or complete the conversation.
Accessing the Flow Table
- Open a report with conversational creative data sources selected
- Switch to the Report tab
- Click the
 icon in the toolbar
 - Select Flow Table from the templates dialog
TIP
The Flow Table template is only available when your selected data sources include conversational creatives. If the data sources have no flow data, the Flow Table option will be grayed out.
Understanding the columns
The Flow Table displays the following columns:
| Column | Description |
|---|---|
| Name | Name of the data source (campaign, creative group, or creative) |
| Type | Type of the data source — Campaign, Creative Group, or Creative |
| Creative | Name of the specific creative. Clickable — opens the creative name in context. |
| Component | The type of flow component (e.g. Prompt, Choice, End) |
| Content | The actual text content of the component |
| Level | The position in the conversation flow, starting from 1 for the first prompt |
| Option | The choice number within a given level (unique per level) |
| Impressions | Number of times this component was loaded during the observation period |
| Continue | Number of impressions that led to further interaction beyond this component |
| Drop | Number of impressions where the user dropped off at this component (shows "-" for Choice rows, since drop-off is measured on prompts, not individual choices) |
| Completed | Number of impressions that reached the end of the conversation flow |
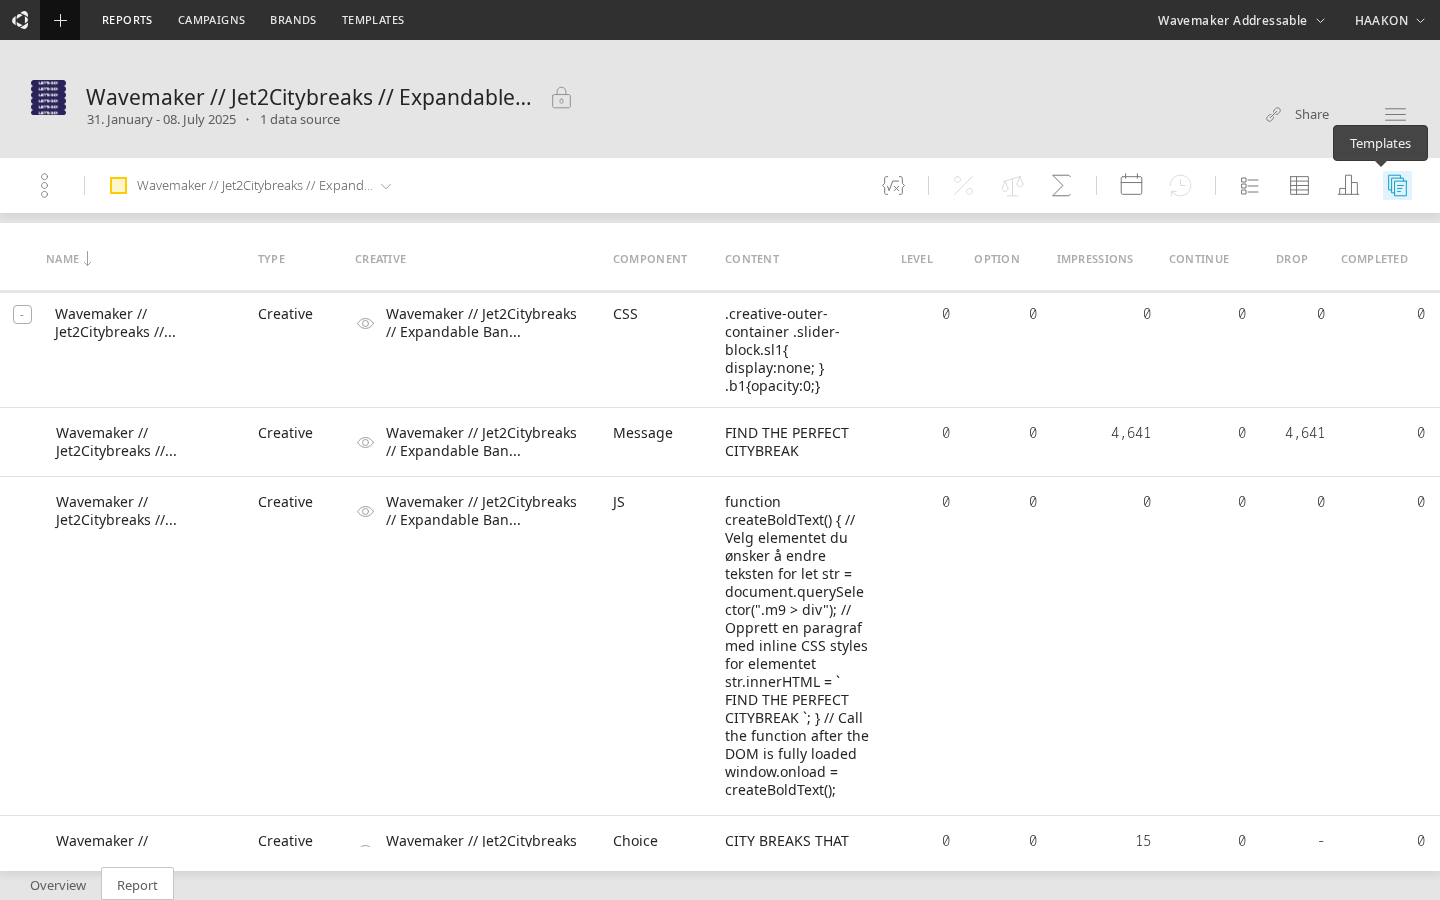
Tree structure
When viewing raw (non-aggregated) data, the Flow Table displays rows in a hierarchical tree structure. Top-level rows represent the first component in each creative's flow. Expanding a row reveals the child components — the choices and subsequent prompts that follow.
Rows are expanded by default, so the tree structure is immediately visible when the Flow Table loads. The screenshot above shows the tree with component types like CSS, Message, JS, and Choice listed under the creative.
This tree mirrors the actual conversation structure: a Prompt at level 1 expands to show its Choice options, each of which may lead to further Prompts at level 2, and so on.
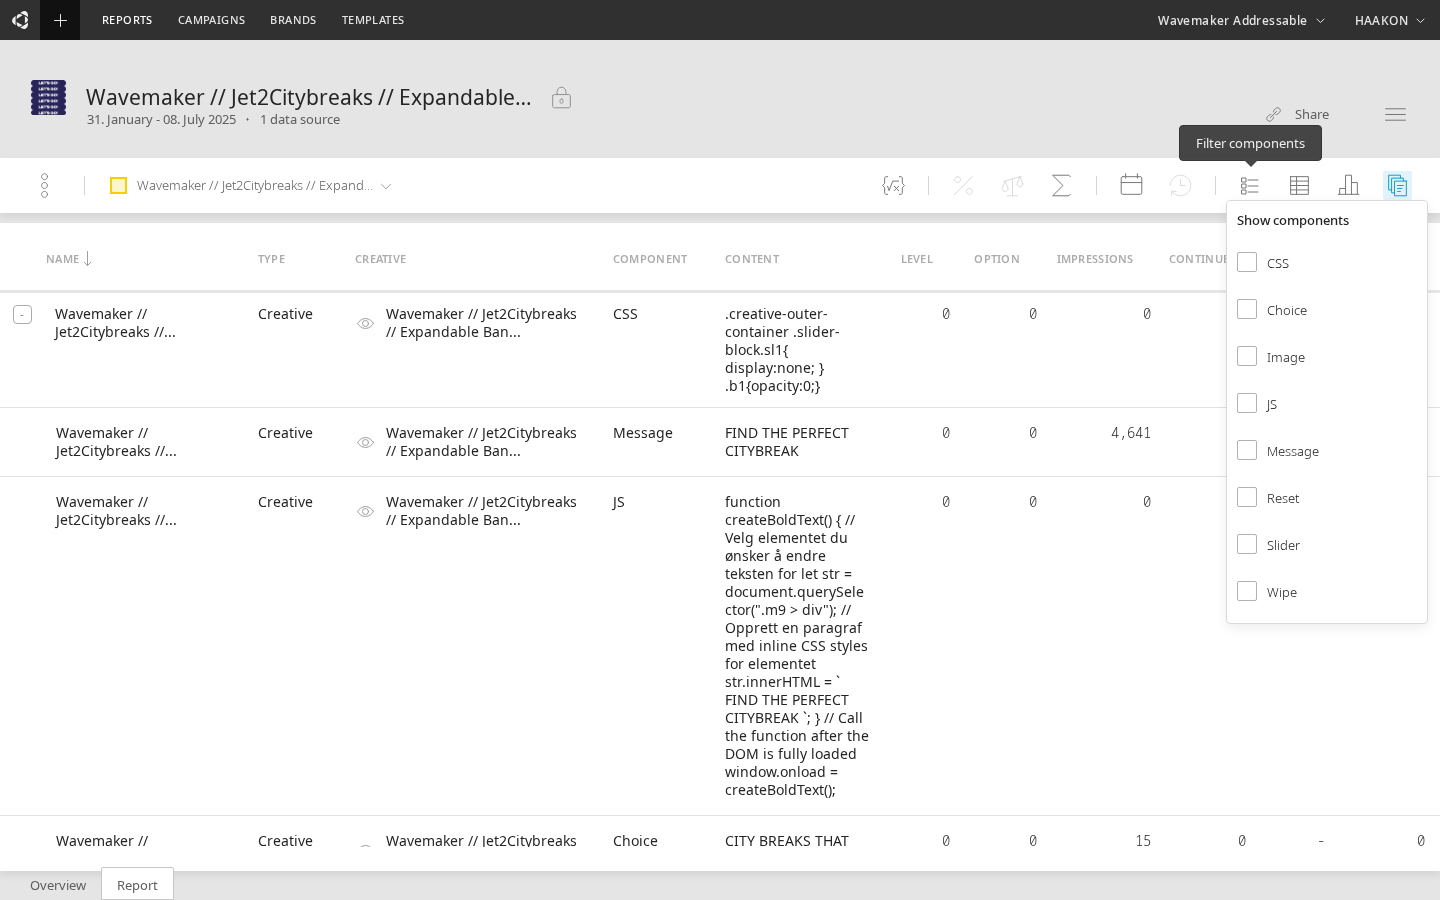
Component type filter
The Flow Table includes a filter button in the toolbar that lets you show only specific component types. This is useful when you want to focus on a particular aspect of the flow:
- Show only Choice components to analyze branching patterns and which options users prefer
- Show only Prompt components to see engagement at each conversation stage
- Show all types (default) for the complete picture
Sorting
Click any column header to sort the table. Clicking the same header cycles through descending, ascending, and unsorted states. Sorting by Option uses a compound sort — it first sorts by Level, then by Option within each level — so the conversation structure stays readable.
Aggregate mode
Toggle the  aggregation button in the toolbar to switch between:
- Raw (default) — one row per component per creative, with the full tree structure
- Aggregate — one summary row per creative, with totals across all components
Raw mode is best for detailed analysis. Aggregate mode is useful for a quick comparison across creatives.
Interactive features
Creative preview
Click the eye icon next to a creative name to open an inline preview of that creative. Click it again (or click the denied-eye icon) to close the preview.
Open in Builder
Click a creative name in the Creative column to open that creative in the Builder in a new tab. Click the Name column to navigate to the campaign or creative group view, depending on the data source type.
Disabled toolbar options
When the Flow Table template is active, the following toolbar options are disabled:
- Rate values (
 ) — not available for Flow Table data
 - Percentile change (
 ) — not available for Flow Table data
Date range, time buckets, and data export remain available as normal.
Use cases
The Flow Table is particularly useful for:
- Identifying drop-off points — find which prompts have the highest drop-off rates to optimize conversation length and content
- Comparing choice popularity — see which choices users select most often at each branching point
- Cross-creative comparison — select multiple creatives as data sources to compare how different conversation designs perform at the component level
- Optimizing conversation paths — combine Level, Continue, and Completed data to understand which paths through the conversation lead to the best outcomes
- Reporting to stakeholders — export the table data as CSV, Excel, or JSON for inclusion in campaign reports